
Article preview View full access options
Nature Physics | Letter
Direct visualization of concerted proton tunnelling in a water nanocluster
- Journal name:
- Nature Physics
- Volume:
- 11,
- Pages:
- 235–239
- Year published:
- DOI:
- doi:10.1038/nphys3225
- Received
- Accepted
- Published online
Proton transfer through hydrogen bonds plays a fundamental role in many physical, chemical and biological processes1, 2, 3, 4, 5. Proton dynamics is susceptible to quantum tunnelling, which typically involves many hydrogen bonds simultaneously, leading to correlated many-body tunnelling6, 7, 8, 9. In contrast to the well-studied incoherent single-particle tunnelling, our understanding of many-body tunnelling is still in its infancy. Here we report the real-space observation of concerted proton tunnelling in a cyclic water tetramer using a cryogenic scanning tunnelling microscope. This is achieved by monitoring the reversible interconversion of the hydrogen-bonding chirality of the water tetramer with a chlorine-terminated scanning tunnelling microscope tip. We found that the presence of the Cl anion at the tip apex may either enhance or suppress the concerted tunnelling process, depending on the details of the coupling symmetry between the Cl ion and the protons. Our work opens up the possibility of controlling the quantum states of protons with atomic-scale precision.
At a glance
Figures
-
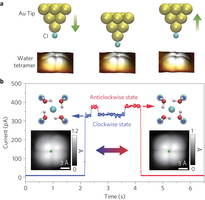
Figure 1: Chirality switching of a H2O tetramer. a, Schematic showing manipulation of the chirality of the tetramer by a Cl-terminated tip. Left: the tetramer stays in the clockwise state (CS) when the tip is far away from the tetramer (gap set with V = 5 mV and I = 5 pA). Middle: reducing the tip height by 230 pm leads to chirality switching. Right: lifting the tip back to the initial height leaves the tetramer in the anticlockwise state (AS). b, Tunnelling current trace recorded during the chirality manipulation shown in a. Two current levels can be clearly distinguished in the range 300–400 pA, where the low and high current levels correspond to CS and AS, respectively. Left and right insets: Adsorption configuration (upper) and STM images (lower) of CS and AS tetramers, respectively. Parameters for the STM images: V = 20 mV and I = 150 pA. The green stars in the STM images denote the tip position where the current trace is acquired. O, H, Au, Cl− and Na+ are denoted by red, white, golden, cyan and blue spheres, respectively.
-
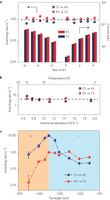
Figure 2: Quantitative analysis of the switching rate. a, Switching rate and tunnelling current as functions of the sample bias. The tip height is fixed at −295 pm. b, Dependence of the switching rate on temperature. Tip height: −260 pm, sample bias: 5 mV. In a and b the statistical error is smaller than the data markers; the average of the switching rates for different bias and temperature is denoted by horizontal dashed lines, showing the negligible dependence on those factors. c, Dependence of the switching rate on tip height. Sample bias: 5 mV. The switching rates are sensitive to the tip height, exhibiting an initial rise (region I) followed by a rapid drop (region II) with decreasing tip height. The error bar represents the standard error. The tip height is referenced to the gap set with V = 5 mV and I = 5 pA.
-
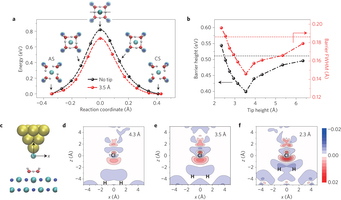
Figure 3: Effect of the tip on the reaction barrier for proton transfer. a, Reaction barrier for interconversion between CS and AS of the tetramer without (black) and with a Cl-terminated tip at a height of 3.5 Å (red), calculated using the cNEB method. Insets show snapshots along the transition path. b, Plots of the effective barrier height and full-width at half-maximum (FWHM) as a function of tip height. The tip height is defined as the distance between the Cl atom on the tip and the centroid of four oxygen atoms of the water tetramer. The horizontal black and red dashed lines denote the barrier height and width without the tip, respectively. c, Atomic model of the Cl–tip/tetramer/NaCl-bilayer system. The origins of x and z axis are set at the Cl atom on the tip. d–f, Two-dimensional slices of the electron density difference when a Cl tip is placed above the tetramer at 4.3 Å (d), 3.5 Å (e) and 2.3 Å (f). The electron density difference is plotted in a plane perpendicular to the surface, which is marked by a dotted line in the uppermost snapshot of a. Red and blue in the colour bar represent electron gain and depletion, respectively. The units of electron density are e Å−3.
-
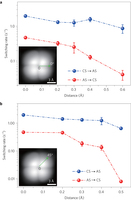
Figure 4: Dependence of the switching rates on the lateral position of the tip. a, Switching rates as a function of tip position obtained by moving the tip along the 0° direction away from the centre of the tetramer. b, Same as a but along the 45° direction. The green arrows in the insets denote the movement directions of the tip. The zero point of the tip position is set about 0.1 Å away from the centre of the tetramer. The error bars represent the standard error. Sample bias: 5 mV. Tip height: −265 pm referenced to the gap set with V = 5 mV and I = 5 pA.
Read the full article
Additional access options:
- British Library Document Supply Centre
- You can also request this document from your local library through inter-library loan services.